
Automated data collection
Build repeatable ways to gather information from business tools, files, websites and other agreed sources.
Business intelligence & data analytics · Nairobi, Kenya
We build tools and workflows that automate data collection, clean and analyze information, then turn the results into clear reports and insights your team can use.
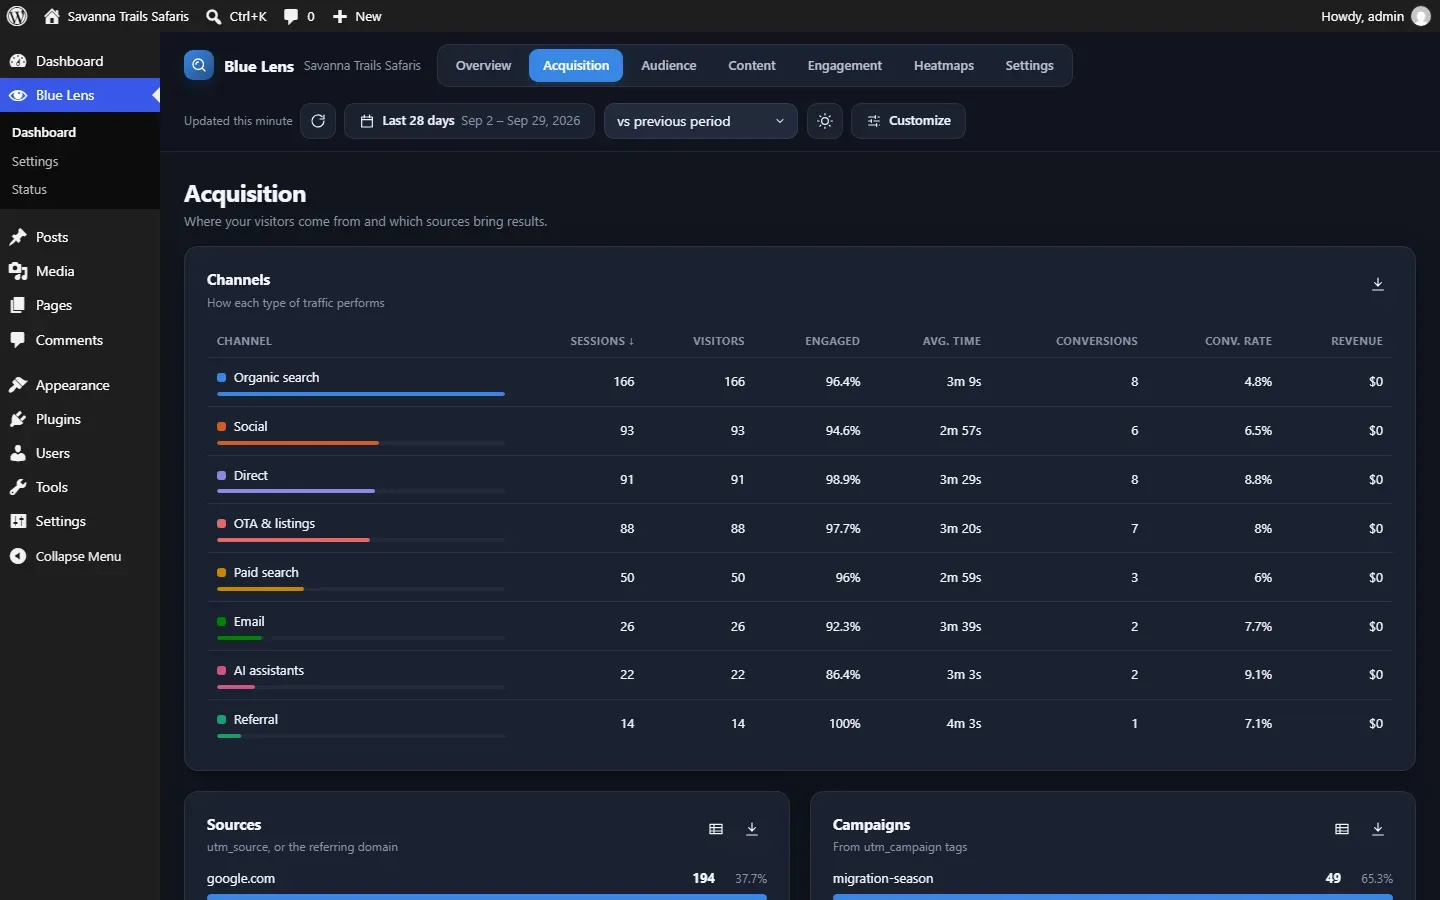
From raw data to decisions
We help connect the steps between scattered data and a reliable view of what is happening in your business.
Build repeatable ways to gather information from business tools, files, websites and other agreed sources.
Organise, validate and prepare incoming data so analysis and reports are based on more consistent information.
Connect collection, transformation, analysis and delivery steps to reduce repetitive manual reporting work.
Explore patterns and performance to answer business questions and identify useful next steps.
GA4 set up properly, with the events and conversions that reflect your business, and consent handled.
Product views, add-to-cart, checkout and purchase data so you can see where buyers drop off.
Enquiries, quote requests, calls and WhatsApp clicks recorded as conversions across GA4, Google Ads and Meta.
UTM conventions and channel reporting so every campaign can be compared fairly.
Interactive dashboards in Power BI, Tableau or Looker Studio, connected to your data sources and built around agreed KPIs.
Define the measures that matter, how each is calculated and who owns it, so every report uses the same numbers.
Trend-based forecasts for sales, demand and other measures, with the assumptions stated clearly.
One screen with the numbers that matter, pulled from your website, store and business systems.
Revenue by product, channel and period, with trends that are easy to read.
How people navigate, engage and convert, from page paths to form abandonment.
Recurring reports and data summaries delivered in a consistent format, with plain-language commentary.
Charts and dashboards designed for the people who use them, not just analysts.
A repeatable data process
We shape the workflow around your sources, data quality needs, analysis questions and the reports your team relies on.
FAQ
Yes. We can build workflows and tools to collect information from agreed sources, prepare and clean it, run repeatable analysis and generate reports.
Yes. We can connect data from your website, store, ad platforms, spreadsheets and business systems, then present the agreed measures in a useful dashboard.
Yes. We can review the available data, identify quality issues and build cleaning and validation steps into the workflow before analysis and reporting.
Power BI, Tableau, Looker Studio or Excel, depending on where your data lives, who will use the dashboard and the licences you already have. We agree the tool during planning.
For website measurement, GA4 can be a good start when configured with relevant events and conversions. For wider business questions, we can combine it with other data sources and tools.
It records the actions that matter to your business, such as enquiries, WhatsApp clicks and purchases, so you can see which pages and campaigns produce results.
That depends on the tool. Google Analytics stores data with Google. Blue Lens Analytics keeps data in your own WordPress database and sends nothing to third parties.
Let's talk
Tell us where your data comes from and what you need to understand. We'll help shape a practical route from collection to reporting.